February 2013
Regression analysis is a statistical technique that is commonly used in litigation because of its unique ability to ascertain both liability and damages. Specifically, litigation invariably involves questions of (i) whether event x caused event y, and (ii) if so, how much did y change because of x. As regression is used more frequently among litigation and economic experts, it becomes increasingly important to understand the basic intuition behind the technique, as well as the correct way to interpret regression output.
A simple example illustrates the usefulness of regression analysis. In a breach of contract case, plaintiff allegedly lost sales. Assuming liability (i.e., had the breach not occurred), Plaintiff would have incurred costs to earn these alleged lost sales. In other words, costs were saved associated with the sales that did not occur. To appropriately calculate damages, these saved costs should be subtracted from any lost sales. Regression analyses can determine (i) what types of costs change when sales change (i.e., variable or saved costs), and (ii) how much the variable costs or saved costs change when sales change.
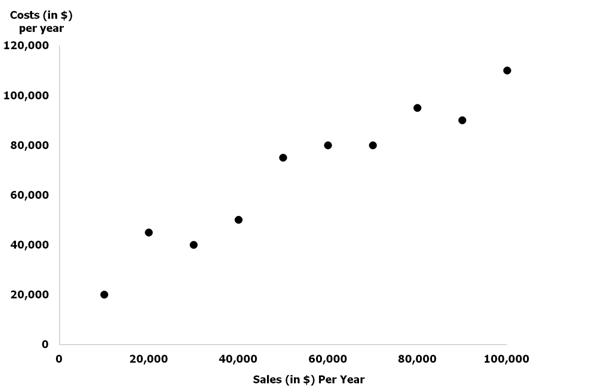
Prior to performing a regression, it is usually useful to plot the data. Below is a scatter plot showing ten pieces of data regarding Plaintiff’s sales and costs. When an independent variable (in the following example, sales) explains the dependent variable (costs), a simple scatter plot provides insight about the relationship. Looking at the scatter plot, our mind almost automatically fits a line that describes how sales relate to costs. In this simple case, there is a positive relationship.
Regression performs this same operation, but does so mathematically with considerably more precision and consistency. Importantly, it also provides us an estimate of how much costs increase as sales increase.

Microsoft Excel and other software packages make regressions simple to execute, enabling non-experts to create models without understanding the underlying statistical formulas. However, expert interpretation of the resulting output is still required.
Interpreting Regression Output
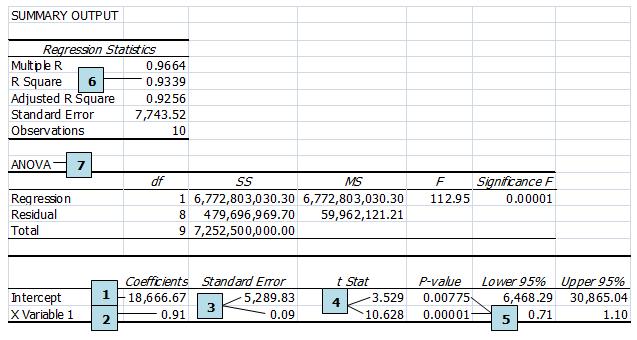
The input and output of a regression model take the familiar form many encountered in high school algebra; specifically y = mx + b. The inputs are y (the dependent variable – plaintiff’s cost in the example above) and x (the independent variable – plaintiff’s sales in the example above). The outputs are m (the slope term) and b (the intercept term). The output that Microsoft Excel produces appears below. In many cases, most of the output is not practically relevant; thus, one should not be intimidated by the seemingly foreign language and numbers below. Our “cheat sheet” table follows the Excel output that identifies and interprets the most relevant variables.

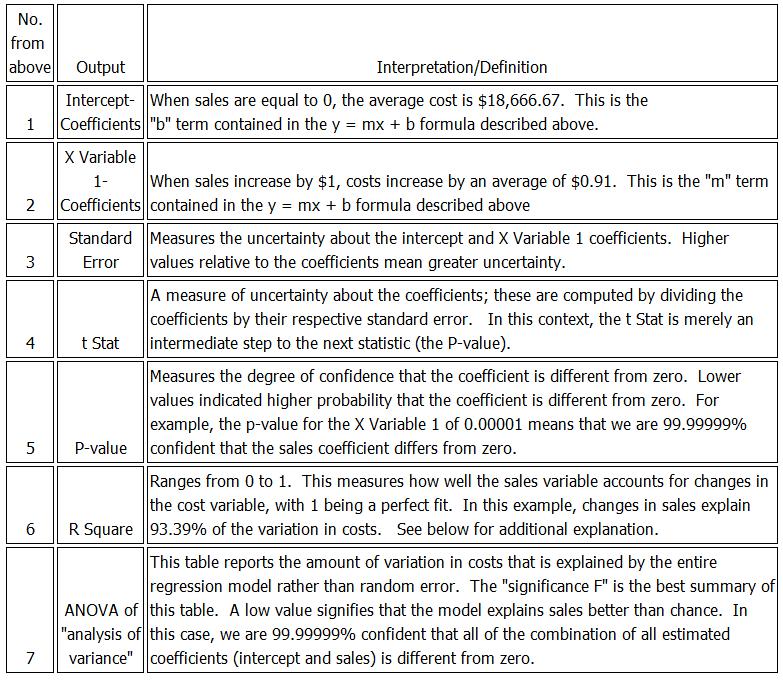
Simple “cheat sheet” table
Using the R Squared
When the primary question of interest is how variables relate to one another, the focus should be on the estimated slope coefficients and their respective p-values. Large slope coefficients with p-values less than 0.05 are typically sufficient evidence of a significant relationship between the variables.
A low R-squared is a good reason to question whether additional variables should be included in the model as a way of improving both the fit of the model and reducing the bias in the estimated relationship. The following cautions are in order:
- The R-squared can be artificially inflated simply by including additional variables that do little to explain the outcome.
- The R-squared changes based on the sample size, and how the data is distributed. This means that R-squared should not be compared across models with different data.
- A high R-squared by itself does not necessary indicate a correct regression model because it does not alert the user to several common mistakes made while running a regression.
Drawing Conclusions
In our breach of contract scenario, two conclusions can be drawn about costs. First, costs do indeed decrease with reduced sales. This means that these costs are not incurred and should be subtracted from damages. Second, we can estimate how much costs decrease per lost sales dollar: 91 cents. Therefore, assuming liability, damages should be 9% of the total lost sales. This 9% is calculated as $1 – $0.91.
Statistical methods can be used for summarizing a collection of data, testing the accuracy or attributes of a population, and for drawing inferences about the population being studied. The intelligent use of statistics can save considerable money in compliance auditing, and data analysis for litigation.

