June 2011
Based on results of its May 2011 survey, the Associated Press (AP) reported that President Obama hit his highest approval rating in two years, with his approval shooting past 50 percent based on the economy:
“President Barack Obama’s approval rating has hit its highest point in two years — 60 percent — and more than half of Americans now say he deserves to be re-elected, according to an Associated Press-GfK poll taken after U.S. forces killed al-Qaida leader Osama bin Laden.
In worrisome signs for Republicans, the president’s standing improved not just on foreign policy but also on the economy, and independents — a key voting bloc in the November 2012 presidential election — caused the overall uptick in support by sliding back to Obama after fleeing for much of the past two years. …
Despite a sluggish recovery from the Great Recession, 52 percent of Americans now approve of Obama’s stewardship of the economy, giving him his best rating on that issue since the early days of his presidency; 52 percent also now like how he’s handling the nation’s stubbornly high 9 percent unemployment.”
Granted, this AP poll was taken closely after the Osama bin Laden killing, so most would expect the President to receive a bump up in the polls. Nevertheless, AP does its readers a disservice by suggesting that the survey results are indicative of future election outcomes. As explained below, AP makes significantly incorrect claims about likely election results because its poll (i) starts with a more Democrat-friendly profile, and (ii) is not based on likely voters.
AP polls start with a population having a different political profile
The AP poll is a telephone survey of the American general population, typically including approximately 1,000 interviews. AP has conducted this type of survey almost monthly since at least April 2009. All of these surveys include some common questions (the same question asked every survey), and new questions based on current events. One of the common questions includes requesting the interviewee to identify themselves as Democrat, Republican, Independent, or none of these. This is a common question amongst nationally-recognized polling firms, such as Gallup and Rasmussen. Both Gallup and Rasmussen asked a similar question in its telephone surveys of the American general population, for at least 22 years and 7 years respectively.
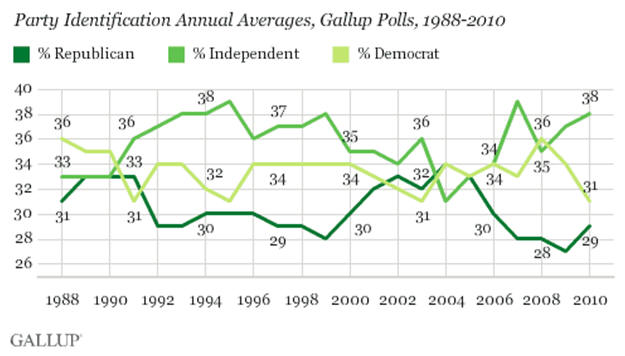
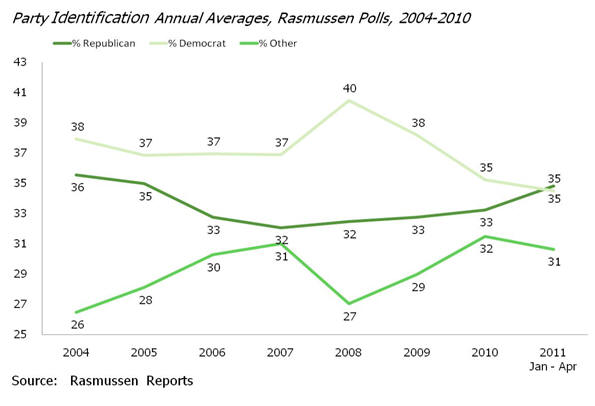
However, the AP results are quite different than what is identified by both Gallup and Rasmussen. Inexplicably, in the AP poll, significantly more people identify themselves as Democrats than Republicans. The following two charts from Gallup and Rasmussen show that Democrats have historically enjoyed an approximately three to four percent advantage over Republicans.
Chart 1:
Chart 2:
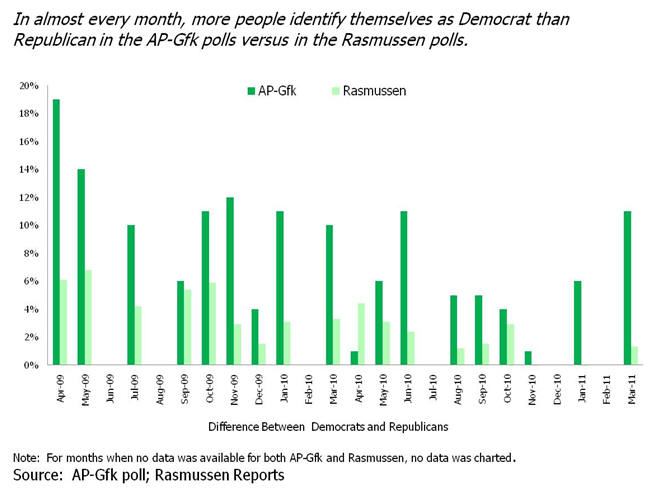
The following third chart shows that, in practically every month where data was available, significantly more people identified themselves as Democrat than Republican in the AP poll than in the Rasmussen poll. In most months, the differences are quite significant. In the most recent May 2011 AP poll that served as the starting point for this article, AP reported that Democrats have a spread of 17 percentage points over Republicans. Although Rasmussen’s May 2011 data is not yet available, Rasmussen’s poll between January 2011 and April 2011 showed Democrats and Republicans have been approximately even. (Monthly data was not available for Gallup to make similar monthly comparisons.)
Chart 3:
In 2010 (when data was available for all three pollsters), both Gallup and Rasmussen had a two-percentage point Democrat edge over Republican. AP had three times that spread, with 6 points. Chart 4 below shows details. Independents and those declining to respond to this question are not included in Chart 4, so the total of respondents does not total 100%.
Chart 4:
The methodologies amongst these three pollsters appear to be similar (i.e., telephone surveys of the general population with similar, if not identical, question wording). Nevertheless, there are undoubtedly methodology differences that are not being reported.
As a group, voters are not representative of the general population
No poll that is based on surveying the American general population should be used as an indicator of upcoming election outcomes. Statistically valid random samples of the general population might be good indicators of the average American’s political identification; however, they are not good indicators of election results.
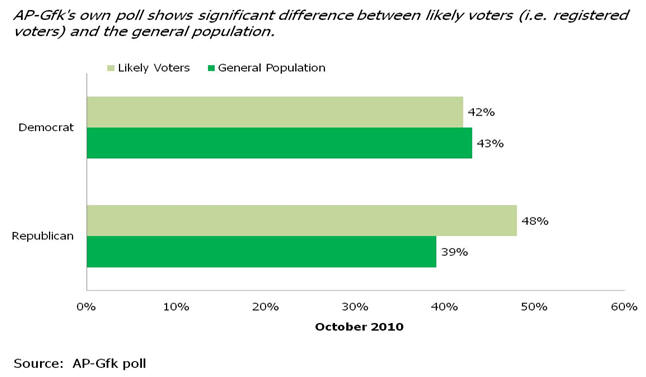
Practically every nationally recognized pollster acknowledges that a statistically valid random sample of likely voters (i.e., registered voters) is the best indicator of upcoming election results. As is seen in results from each of the three pollsters, Democrats have an edge in the general population surveys. However, Republicans are more likely to participate in elections. Even the AP poll recognizes this. In one of its monthly surveys conducted in October 2010, AP conducted two different polls with the same party identification: one poll of likely voters and one poll of the general population. Chart 5 below shows that more likely voters identify themselves as Republican (48%) than as Democrat (42%); in contrast, more of the general population identify themselves as Democrat (43%) than as Republican (39%). In short, because of the change in which group is larger, likely voters vs. the general population show a significant 10 point swing between the two populations. This is shown graphically in the following chart 5.
Chart 5:
Polls are useful to gather data in a wide variety of situations. However, their design and interpretation must be performed properly. Our Primer On Creating & Using Surveys provides guidance on what to consider.
Fulcrum Inquiry performs economic and statistical consulting. We prepare and analyze surveys as a means of obtaining data for our consulting assignments when needed information is not otherwise available.


