April 2013
Every fan loves his sport. There is much debate over which sports are growing in popularity and which are on the decline. Although popularity does not necessarily indicate superiority, it does tell us something about public opinion on the topic. One way to approximate each sport’s relative popularity is to look at web search trends over time. Google Trends simplifies this task tremendously by reporting the relative frequency by which certain words or phrases are entered into Google’s search engine.
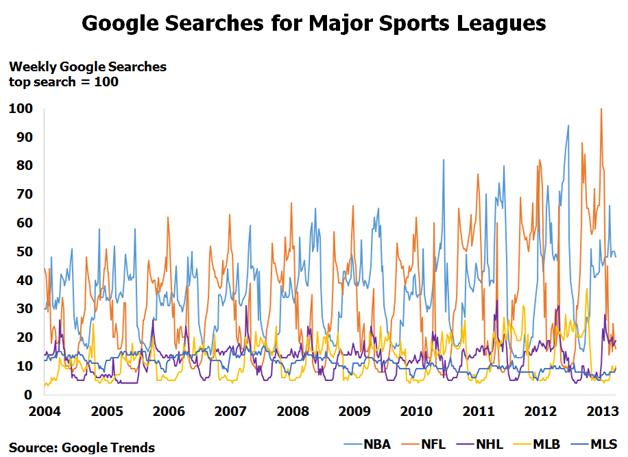
The chart below plots the raw data from Google Trends for the five major sports leagues in the United States: NBA, NFL, NHL, MLB, and MLS. The seasonal nature of these sports means that search frequencies vary dramatically over the course of each year, making some graphical comparisons difficult without further analysis.
To make the above series more usable, we can remove seasonality from the series in a process called time series decomposition. This process splits a time series into the following three components: (i) seasonal, (ii) trend, (iii) random noise. Depending on the data, seasonal trends are determined by summarizing patterns that occur yearly, monthly, or weekly. In the present case, we have weekly data from 2004 – 2013, which means that a particular week in any year should bear a resemblance to that same week in the remaining years. For example, the first week of 2004 should be similar to the first week of 2005, 2006, etc. The second component (the trend) is computed using a series of several local regressions called a loess procedure. Finally, the random noise is calculated by subtracting the seasonal and trend components from the original time series. For comparative purposes here, we ignore the random noise since it only distracts from the underlying trend.
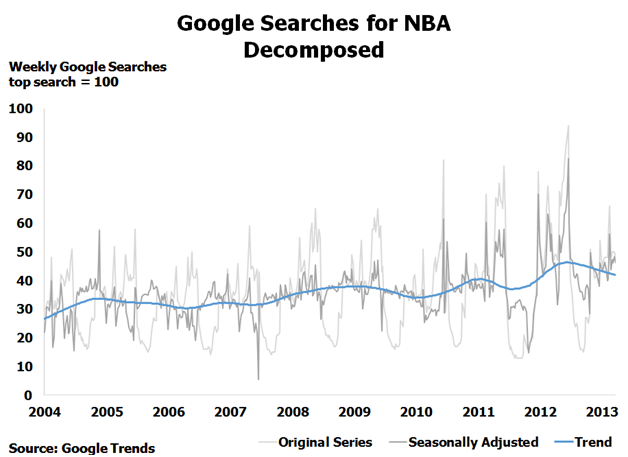
Performing such an analysis on the search term NBA illustrates the improved clarity of the results. The chart below shows (i) NBA searches, (ii) seasonally adjusted NBA searches (calculated by subtracting the seasonal component from the original series), and (iii) the underlying trend of NBA searches.
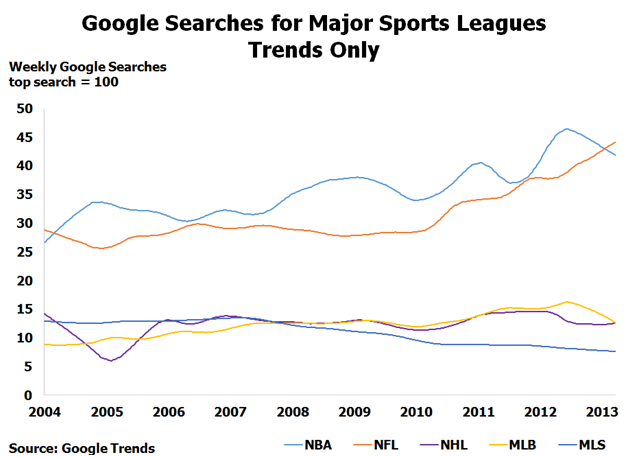
While the blue line above makes discerning the underlying trend significantly easier, its real value in this analysis is in improving the ability to make comparisons between the five sports leagues, as demonstrated below:
The plot above is much more usable because the underlying trends are readily apparent and the erratic movements are smoothed. NBA and NFL searches are higher than the other sports and have generally increased considerably during the period under review. MLB and NHL searches are less common and relatively consistent with some fluctuations. MLS, which is often described as growing in popularity, is the only league with markedly decreasing searches.
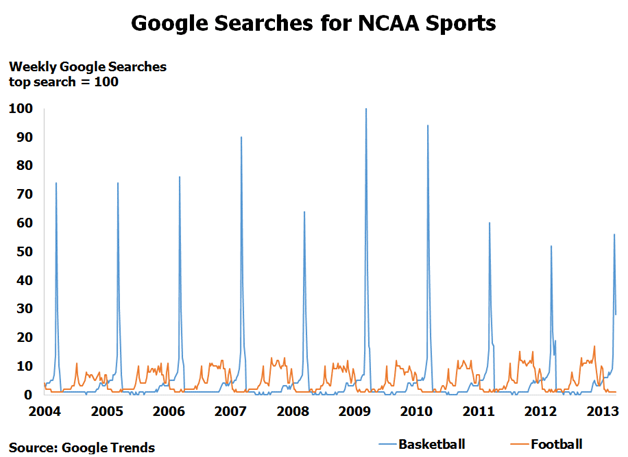
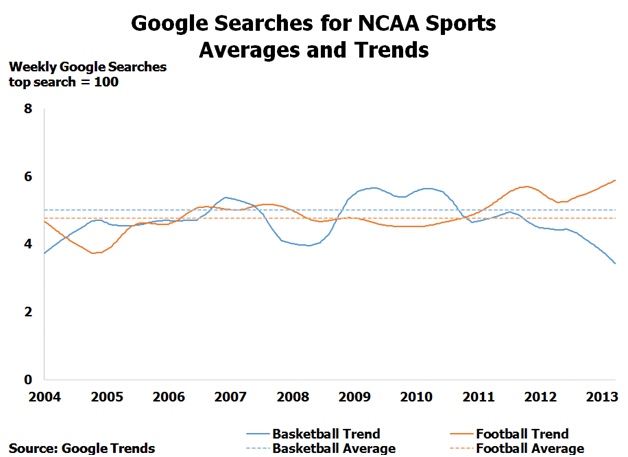
For those whose interests lie with the college circuit, the analysis can also be applied to NCAA sports. In a simple comparison of weekly search terms, the comparability is muddled by the spike in popularity associated with March Madness:
The above peaks certainly make an argument for the popularity of NCAA basketball. But it turns out that time series decomposition tells a different story in recent years:
These types of analytics are useful in understanding seasonality and normalizing trends beyond the sports arena. For instance, the Bureau of Labor statistics often reports seasonally adjusted statistics in favor of raw data. The same is true of many economic indicators and in many financial forecasting exercises.
Fulcrum Inquiry performs statistical analyses in litigation.

